Time: Feb 21 - Feb 28
![]() NEAR Explorer Stats
NEAR Explorer Stats
![]() NEAR Ecosystem Scoreboard
NEAR Ecosystem Scoreboard
Work in progress
What happened?
Monthly Active Developer — MAD
MAD Internal (based on CLI data in the last 30 days)
Monthly Active Developer(Internal) is defined as all users who used CLI at least once in the past month, since CLI is the center tool for development on NEAR at the moment.

Increase curve and trend starting from February from 423 to 706, a 67% monthly increase.
Daily Active Developer (External)
This data is defined as developers who interacted with our core repo on Github. Provided by Electric Capital.

Ecosystem Scoreboard
Stats on Mar 1


Stats on Feb 22

Monthly Active Developer(Internal): 584 → 710 (+21.58%)
Monthly Active Developer(External): 115 → 101 (-12.17%)
Total Amount Transacted: 2,951,450,212 → 3,001,254,558 (+49,804,346, +1.7%)
Total Amount Transacted is the sum of all transactions amount in the NEAR ecosystem.
Key Efforts Last week
Many of these are key contributing factors to the data changes last week
Feb 23
- Flux Blog Article Part 1
- H3LLODecentralization Virtual Event - Peter
- H3LLODecentralization Virtual Event - Matt
Feb 24/25
Feb 23 - 26
Feb 26
- Moonpay funding of NEAR spiked
I know this might not be the full list, so please feel free to add more amazing things in the thread.
Top Line Metrics Dive
Daily New Developer
From CLI data last week

An increase by 100% to 42 users happened on Feb 23rd, most likely a result of the H3LLODecentralization event.
Another increase took place on Feb 26th, likely because of the Mintbase launch and education initiatives, including NEAR Developer Certificate Program and Figment learn updates.
Weekly Active Developer Internal & Weekly Active Dev-deploy/Deploy
From CLI data in the last 30 days

An increase started from 25th to 27th, 196 to 249, by 27%. Could be resulted from both Mintbase announcements and the Developer Certificate program.
The ratio between Weekly Active Developer and Weekly Active Dev-deploy/deploy remains in the similar level, indicating stable engagements of active developers.
Daily New Accounts (last 30 days)

A jump happened on 26th, reached 773 from 651 on the 25th, by 18.74%. The change is likely a result of the token price increase on the 26th.
Daily New Contracts (last 30 days)
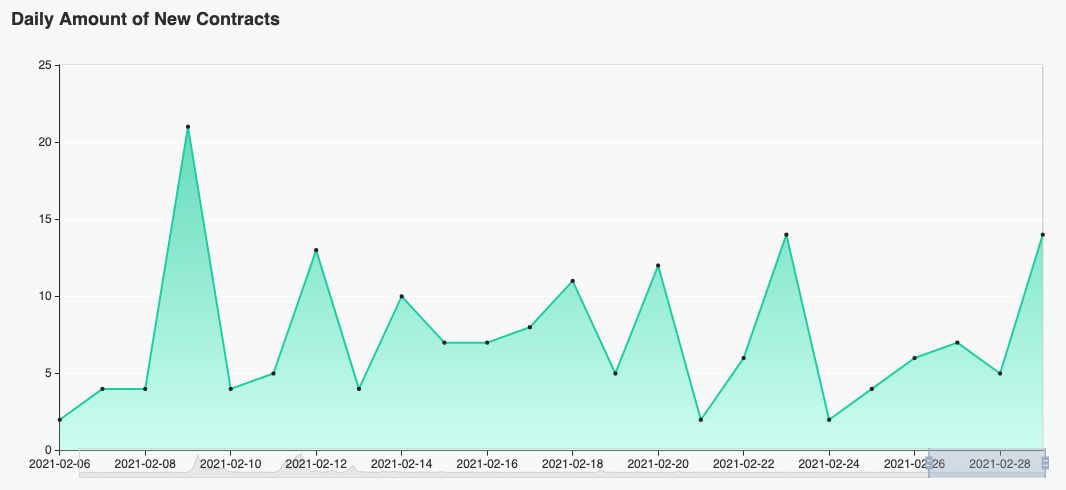
A jump of 14 new contracts happened on the 23rd last week.
Daily Number of Active Contracts MainNet (last 30 days)
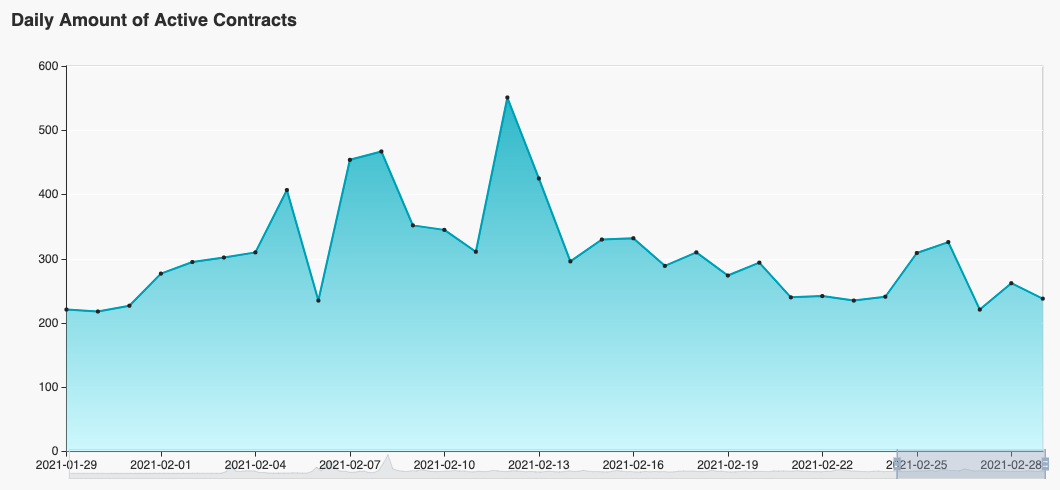
Jumps happened on the 25th and another increase on the 26th. This likely was because of the Mintbase launch and events. In addition, a combined force of token price change and new accounts created were also factors played here. This change also positively indicates new users had some engagements and activities after account creation.
Key Contributing Event Data
NEAR Price in the last 30 Days

NEAR price reached its two highest points on 25 and 26 last week to $4.6~$4.7.
All data at NEAR are anonymous and follow GDPR