Time: Feb 28 - Mar 7
If you don’t have the access to the dashboard or reports, or have any questions would like to discuss, please feel free to contact Tiffany(tiffany@near.org)
What happened?
Monthly Active Developer — MAD
MAD Internal (based on CLI data in the last 30 days)

Overall, last week’s average level was still an increase compare to previous week, with a bump on March 4th.
Daily Active Developer (External)

The highest point of last week data was higher than all previous week, showing an increase in developer engagement, similar to the MAD(internal) chart above. The lower points in the chart were showing the lessened activities during weekends.
Ecosystem Scoreboard
Stats on Mar 8


Stats on Mar 1


Note: The percentages next to the numbers are the comparisons to pervious week(7 days ago), with green showing increase and red showing decrease.
Monthly Active Developer(External): 101 → 111 (+9.9%)
Key Efforts Last week
Many of these are key contributing factors to the data changes last week
Mar 1
- Berry.cards Beta Version Launched
Mar 2
- Marketing Townhall
- Coin98 Wallet Announcement of supporting NEAR
- Engineering Update, including updates on Project Aurora
- NEAR Live Contract Review on berry.cards
Mar 3
- Project Spotlight: TessaB - Blockchain for the Mobile Phone Industry Blog Post
- NEAR is in the Top 50 - Crypto Valley VC Report Blog Post
- Mintbase on NEAR Testnet Lining Post
Mar 4
- Figment-Paras tutorial on creating NFT Marketplace on NEAR in AssemblyScript
- NEAR Swag 2.0 Update by Swagger DAO
- NEAR supported by on Coinmerce
Mar 5
- Proof-of-Stake: The New Paradigm Panel with Illia and Peter
- EVM Update
I know this might not be the full list, so please feel free to add more amazing things here.
Top Line Metrics Dive
Daily New Developer
From CLI

An increase of 84% to 46 new developers happened on March 2nd, and continued to March 3rd. The reasons were likely the launch of berry.cards and the announcement that NEAR is in the top 50 Crypto Valley VC Report.
Weekly Active Developer Internal & Weekly Active Dev-deploy/Deploy
From CLI data in the last 30 days

The increase happened on March 3rd, with 11.95% increase to 281, and then 288 on March 4th, achieving the highest point in the last 30 days. The reasons were believed to be the combined influences of berry.cards and Paras-Figment NFT tutorials.
However, one thing to notice was that even though the weekly active user increased on March 2nd and 3rd, the weekly active dev-deploy/deploy decreased, as oppose to the matching lines of these two metrics previously. This could potentially because a fair amount of developers were using CLI to interact with dapps like berry.cards and exploring NEAR via Figment.
Daily Transactions (last 30 days)
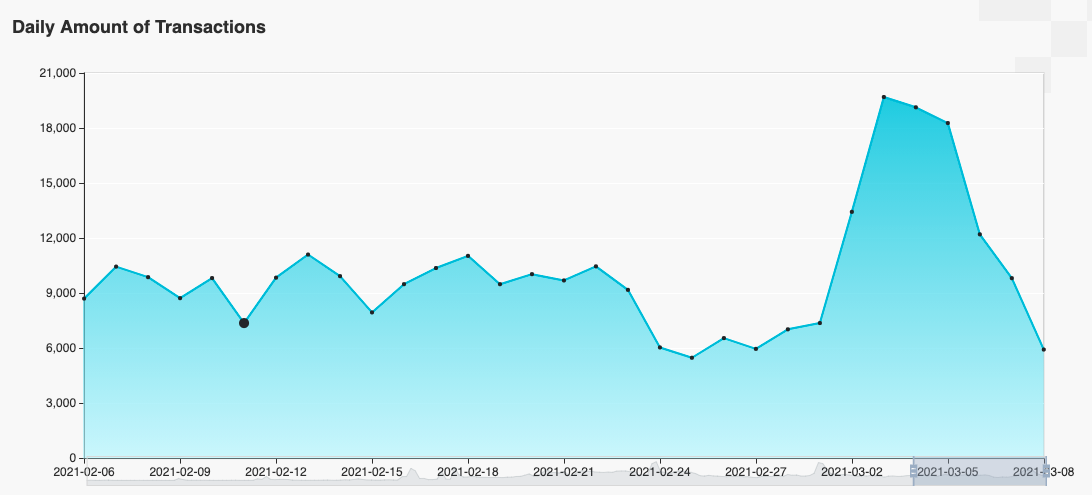
The largest increase in the last 30 days happened on March 3rd, reached 19,693 transactions per day, increased by 266.7% and continued in the similar level until March 5th. The increase was most likely a result of berry.cards engagements, as shown in the berry.cards contract engagements in the bottom chart.
Key Contributing Event Data
Berry Club Contracts Engagements

This chart shows Main Berry Club contracts engagements in the last 30 days. the contract of berry.cards launched on March 1. Then, the engagement quickly increased to 7.5k on March 2nd and reached 9393 daily transactions on March 3rd. The engagement was unprecedented among all contracts, showing the huge success of berry.cards.
NEAR Price in the last 30 Days

NEAR price remained stable last week at around $4.2. Therefore, there was limited impact to the ecosystem made by token price changes.