Time: May 02 - May 09
If you don’t have the access to the dashboard or reports, or have any questions would like to discuss, please feel free to contact Tiffany(tiffany@near.org)
What happened?
Monthly Active Developer — MAD
MAD Internal (based on CLI data in the last 30 days)

MAD decreased to around 450-500 last week.
Daily Active Developer (External)

External active developer increased by a small percentage last week though the MAD internal count decrease, showing more developers were interacting with the core repos.
Ecosystem Scoreboard


Note: The percentages next to the numbers are the comparisons to pervious week(7 days ago), with green showing increase and red showing decrease.
Monthly Active Developer(External): 108 → 117 (+9.35%)
Key Efforts Last week
Many of these are key contributing factors to the data changes last week
May 3
May 4
- Fireside chat featuring Illia
- LearnNEAR tutorial of attach certificate of NFT to twitter account
May 6
- Vorto Game is building on NEAR
- Pluminite announcement
- StakeGG beta ready on NEAR
May 7
- Suter Shield announcement of building on NEAR
I know this might not be the full list, so please feel free to add more amazing things here.
Top Line Metrics Dive
Daily New Developers
From CLI
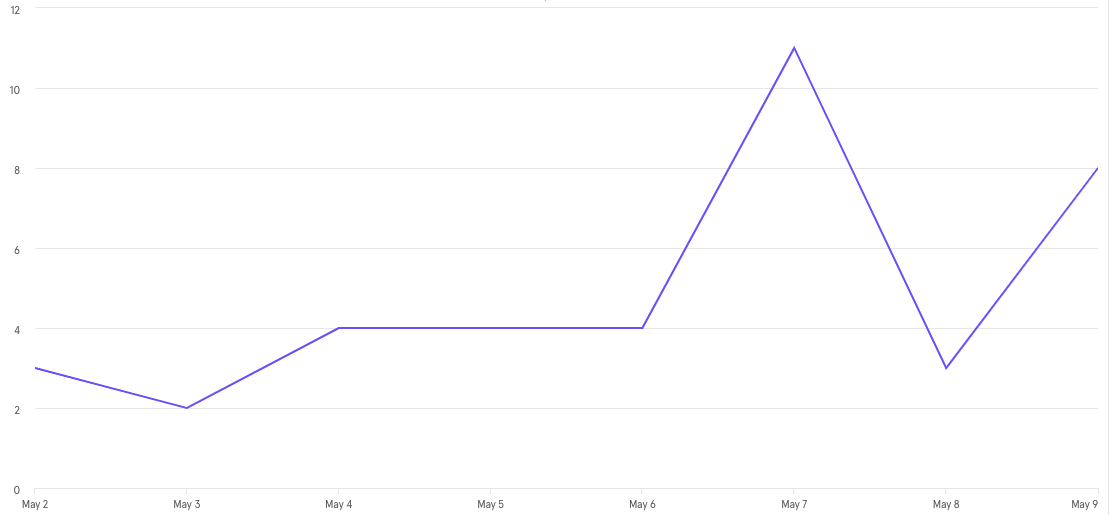
Number of new developers increased on May 7th and on May 9th.
Weekly Active Developer Internal & Weekly Active Dev-deploy/Deploy
From CLI data in the last 30 daysWeekly

Weekly active developer decreased to the level of 100 by the end of last week, however, weekly active dev-deploy/deploy increased back to the level of 25-50, thus making the ratio of the two decrease. This is concerning in that the drop of the weekly active developer is rather steep.
Daily Number of Transaction (last 30 days)

An increase in total number of transactions also happened on May 7th, corresponding the number of new developer increased above, showing that new developers were interacting with the chain and engaging with the ecosystem.
Bridge Top Line Metrics
Comparison to last week:
Total Liquidity Hold: $707,951 to $702,433(-7.79%)
Total Transactions Count: 436 to 452(+3.67%)

We see a slight decrease in the liquidity hold by the bridge. However, deposit actions were still performed during the week and engagements with bridge were continued last week as well.
Main Contracts Engagements (last 30 days)


From top to bottom are: Ref-finance, Pulse/Flux, Paras, BerryClub+BerryFarm+BerryCard, Mintbase, NEAR Crowd
Dapp performances were all experiencing slight decrease in the last week compared to the previous hype among all, therefore, can be concluded as the normal decrease back to the average and stable activity level.